Optimizer Plan Visualization Tool
Stratosphere’s hybrid approach combines MapReduce and MPP database techniques. One central part of this approach is to have a separation between the programming (API) and the way programs are executed (execution plans). The compiler/optimizer decides the details concerning caching or when to partition/broadcast with a holistic view of the program. The same program may actually be executed differently in different scenarios (input data of different sizes, different number of machines).
If you want to know how exactly the system executes your program, you can find it out in two ways:
-
The browser-based webclient UI, which takes programs packaged into JARs and draws the execution plan as a visual data flow (check out the documentation for details).
-
For programs using the Local- or [Remote Executor] (http://stratosphere.eu/docs/0.4/program_execution/remote_executor.html), you can get the optimizer plan using the method
LocalExecutor.optimizerPlanAsJSON(plan). The resulting JSON string describes the execution strategies chosen by the optimizer. Naturally, you do not want to parse that yourself, especially for longer programs.
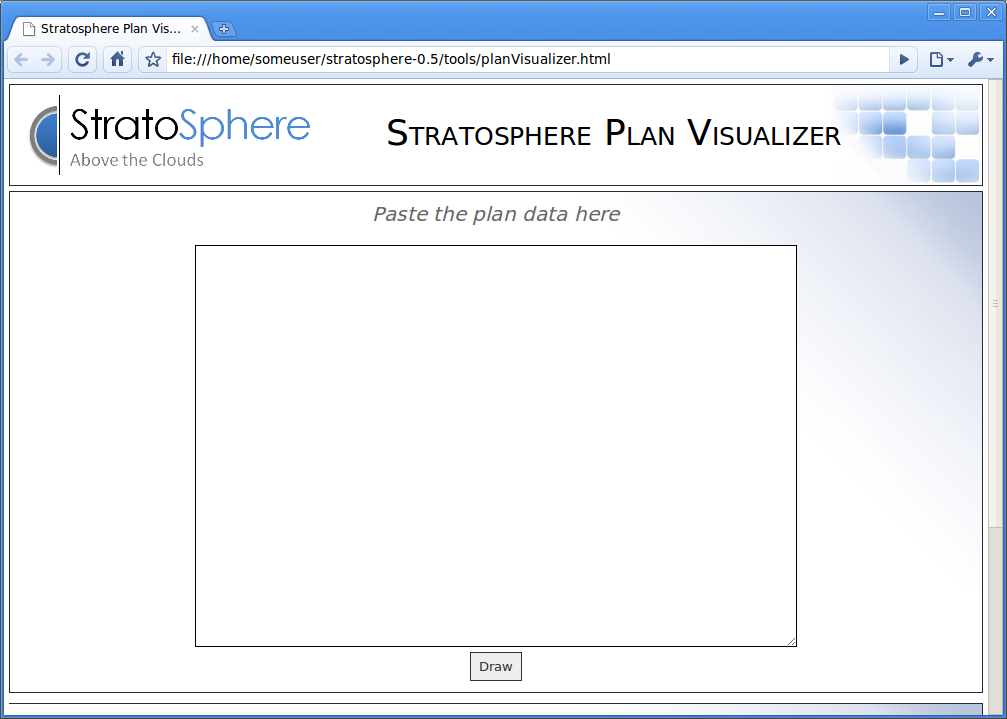
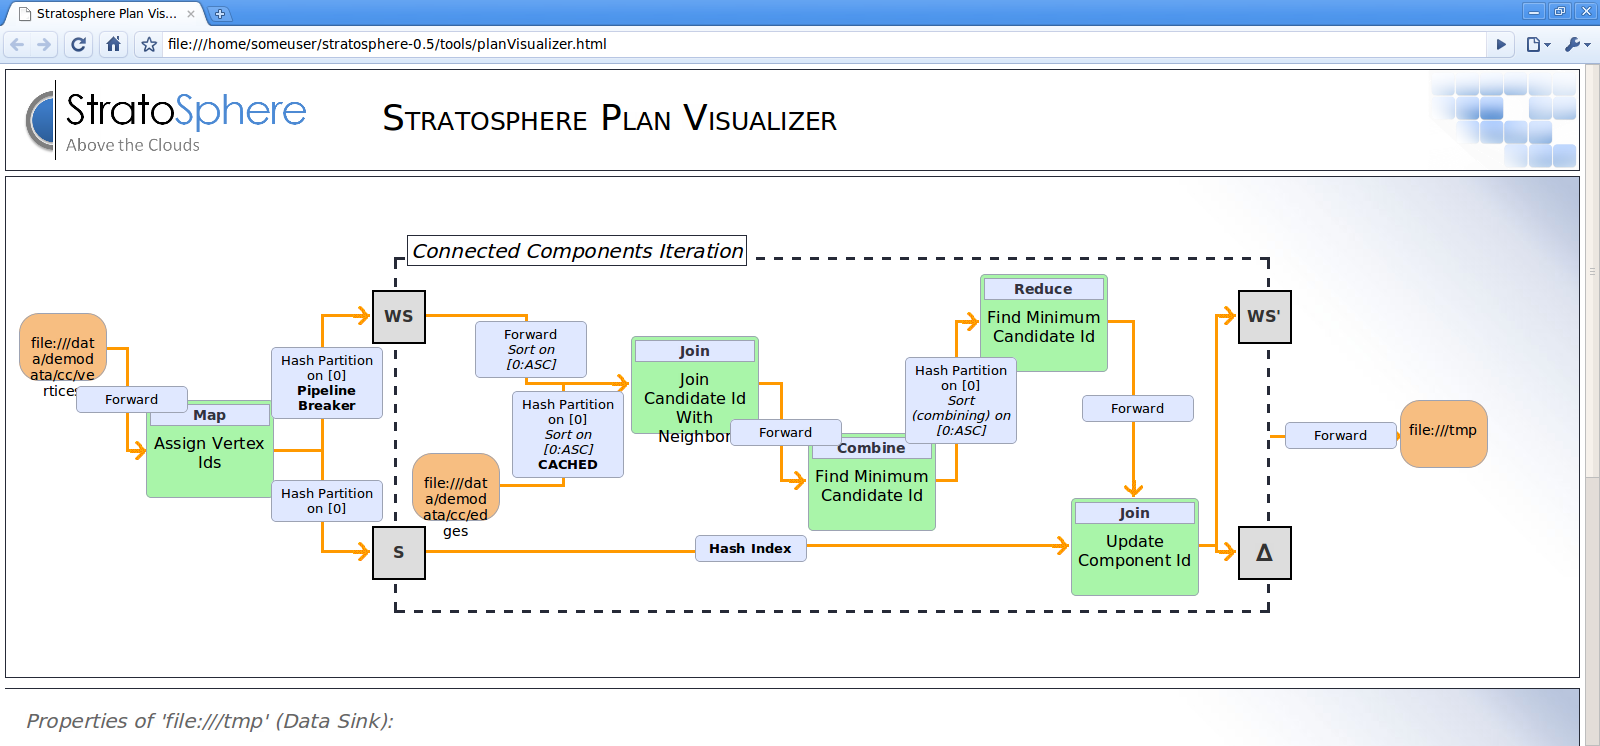
The builds 0.5-SNAPSHOT and later come with a tool that visualizes the JSON string. It is a standalone version of the webclient’s visualization, packed as an html document tools/planVisualizer.html.
If you open it in a browser (for example chromium-browser tools/planVisualizer.html) it shows a text area where you can paste the JSON string and it renders that string as a dataflow plan (assuming it was a valid JSON string and plan). The pictures below show how that looks for the included sample program that uses delta iterations to compute the connected components of a graph.